Our research in 2019 on automating data reuse
What’s the best Open Data interface for my dataset?
It depends.
Our research topic is Open Data and Knowledge on Web-Scale. If we want more people to publish their data, we need to work on:
- Testing the scalability and cost-efficiency of Web APIs
- When publishing data openly, we need to know how the web service will scale when more queries get asked. How it scales immediately also defines the cost-efficiency of such a web-service, as the better it scales, the more cost-effient a Web API will be.
- Testing the user-perceived performance of Web APIs.
- The real performance of a Web API is interesting, but what really matters is how users perceive the performance as an end-user. Maybe more data might be transferred, yet that may raise the probability that some data can come directly from cache and thus raises the user-perceived performance.
- Qualitative research raising interoperability and simplifying reconciliation
- We are mapping the hurdles in the creation process of a dataset and its relation to other datasets. E.g., what’s needed to make your dataset interoperable with others datasets?
Keeping this in mind, our main research question for 2019 becomes: “How do you fragments datasets bigger than 50kb?” We are doing this both quantitatively, by measuring in lab and production environments what the effects are on cost-efficiency and user-perceived performance, as qualitatively, by reporting what worked and what didn’t with one of the many organization we collaborate with. While many technical approaches can be thought of, still the organizational problem to put them into place are even more challenging.
Fragmenting datasets bigger than 50kb
When we want clients to solve questions automatically with Open Data, we on the one hand do not want them to have to download gigabytes of data dumps before being able to solve a question. On the other hand, we also do not want servers to solve all questions for us, because then we did not solve the problem of Open Data we had in the first place (how would these servers have integrate all necessary data then?).
From the moment a dataset does not fit in one page any longer, we need to fragment this dataset. We tested what would be the best page size of train departures in Linked Connections, and when compressing the HTTP responses, 50kb seems like a sweet spot. As we did not yet test this in other domains yet, we generalize this number to all other datasets and use this as a good estimate. So, from the moment we would publish a Linked Data document – being it in HTML, JSON-LD, TriG, or anything else – from the moment it exceeds 50kb, we should think about splitting the documents in fragments. Depending on the feature that is needed and depending on which parameter the dataset needs to scale, the type of links (or hypermedia controls) and the type of fragmentation get decided.
One of the most straight-forward ways to fragment a dataset is using a paged collection. A client could then download the first page of a paged collection, do joins and other operations with other datasets, and only when more data is needed, fetch the next page. Yet, is that it? Can’t we do more to raise the user-perceived performance? E.g., what if we tell the client that the paged collection is ordered in some way? And if it’s ordered alphabetically, geographically or chronologically, can’t we speed up text search, geospatial lookups or time queries?
Full Text Search
Full Text Search is the engine behind many auto-completion forms.
Today, full text search is taken for granted. It is a heavily researched domain that tries to optimize search on machines with a fixed dataset. It will be very hard for any other solution to beat the state of the art on cost-efficiency, user-perceived performance as well as the ease to set it up for your organization.
Yet... I want to try someting different. Today on the Web there are two common ways to allow a data consumer to do text search in your database: or you allow them to download your entire data dump, or you allow them to send a partial string to the server and the server will give an answer that’s non negotiable. Can’t we fragment a dataset by text strings, and ensure that a client can understand that it can now only download the right part of the dataset (~50kb) in order to solve the question on the client-side?
We are currently working on an implementation of a Patricia Trie, a Ternary search tree and a suffix array. As we are setting up the experiments, we are extremely curious to see what the effect will be on the cost-efficiency and on the user-perceived performance.
If someone has a good dataset, with query logs of the past month we can reenact, we would be more than willing to peform our evaluation on your dataset!
Geospatial data
When we are talking database indices, geospatial ones are not to be forgotten. In this field, strong standards are what organizationally makes it very complex to change anything. E.g., the INSPIRE directive in Europe sets out principles that every member state needs to have a National Access Portal with all geospatial services. This means, every geo-database in your administrations need to be able to handle any geospatial request possible at a certain time.
In order to start change in this area, again I want to research how much more cost-efficient it would become to do the geospatial querying on the client-side instead.
1. Geospatial Trees
Specialized data structures, such as an R-Tree, exist to store geospatial data. A search algorithm can descend the tree to look for data that is in the vicinity of each other.
We have implemented this and have introduced the Tree Ontology to describe the hypermedia links between the pages. The simplicity is striking: we only need to describe how a child relates to its parent document, and there are not that many relations we can imagine we need to implement. The Tree Ontology in this way allows to expose any kind of search tree possible.
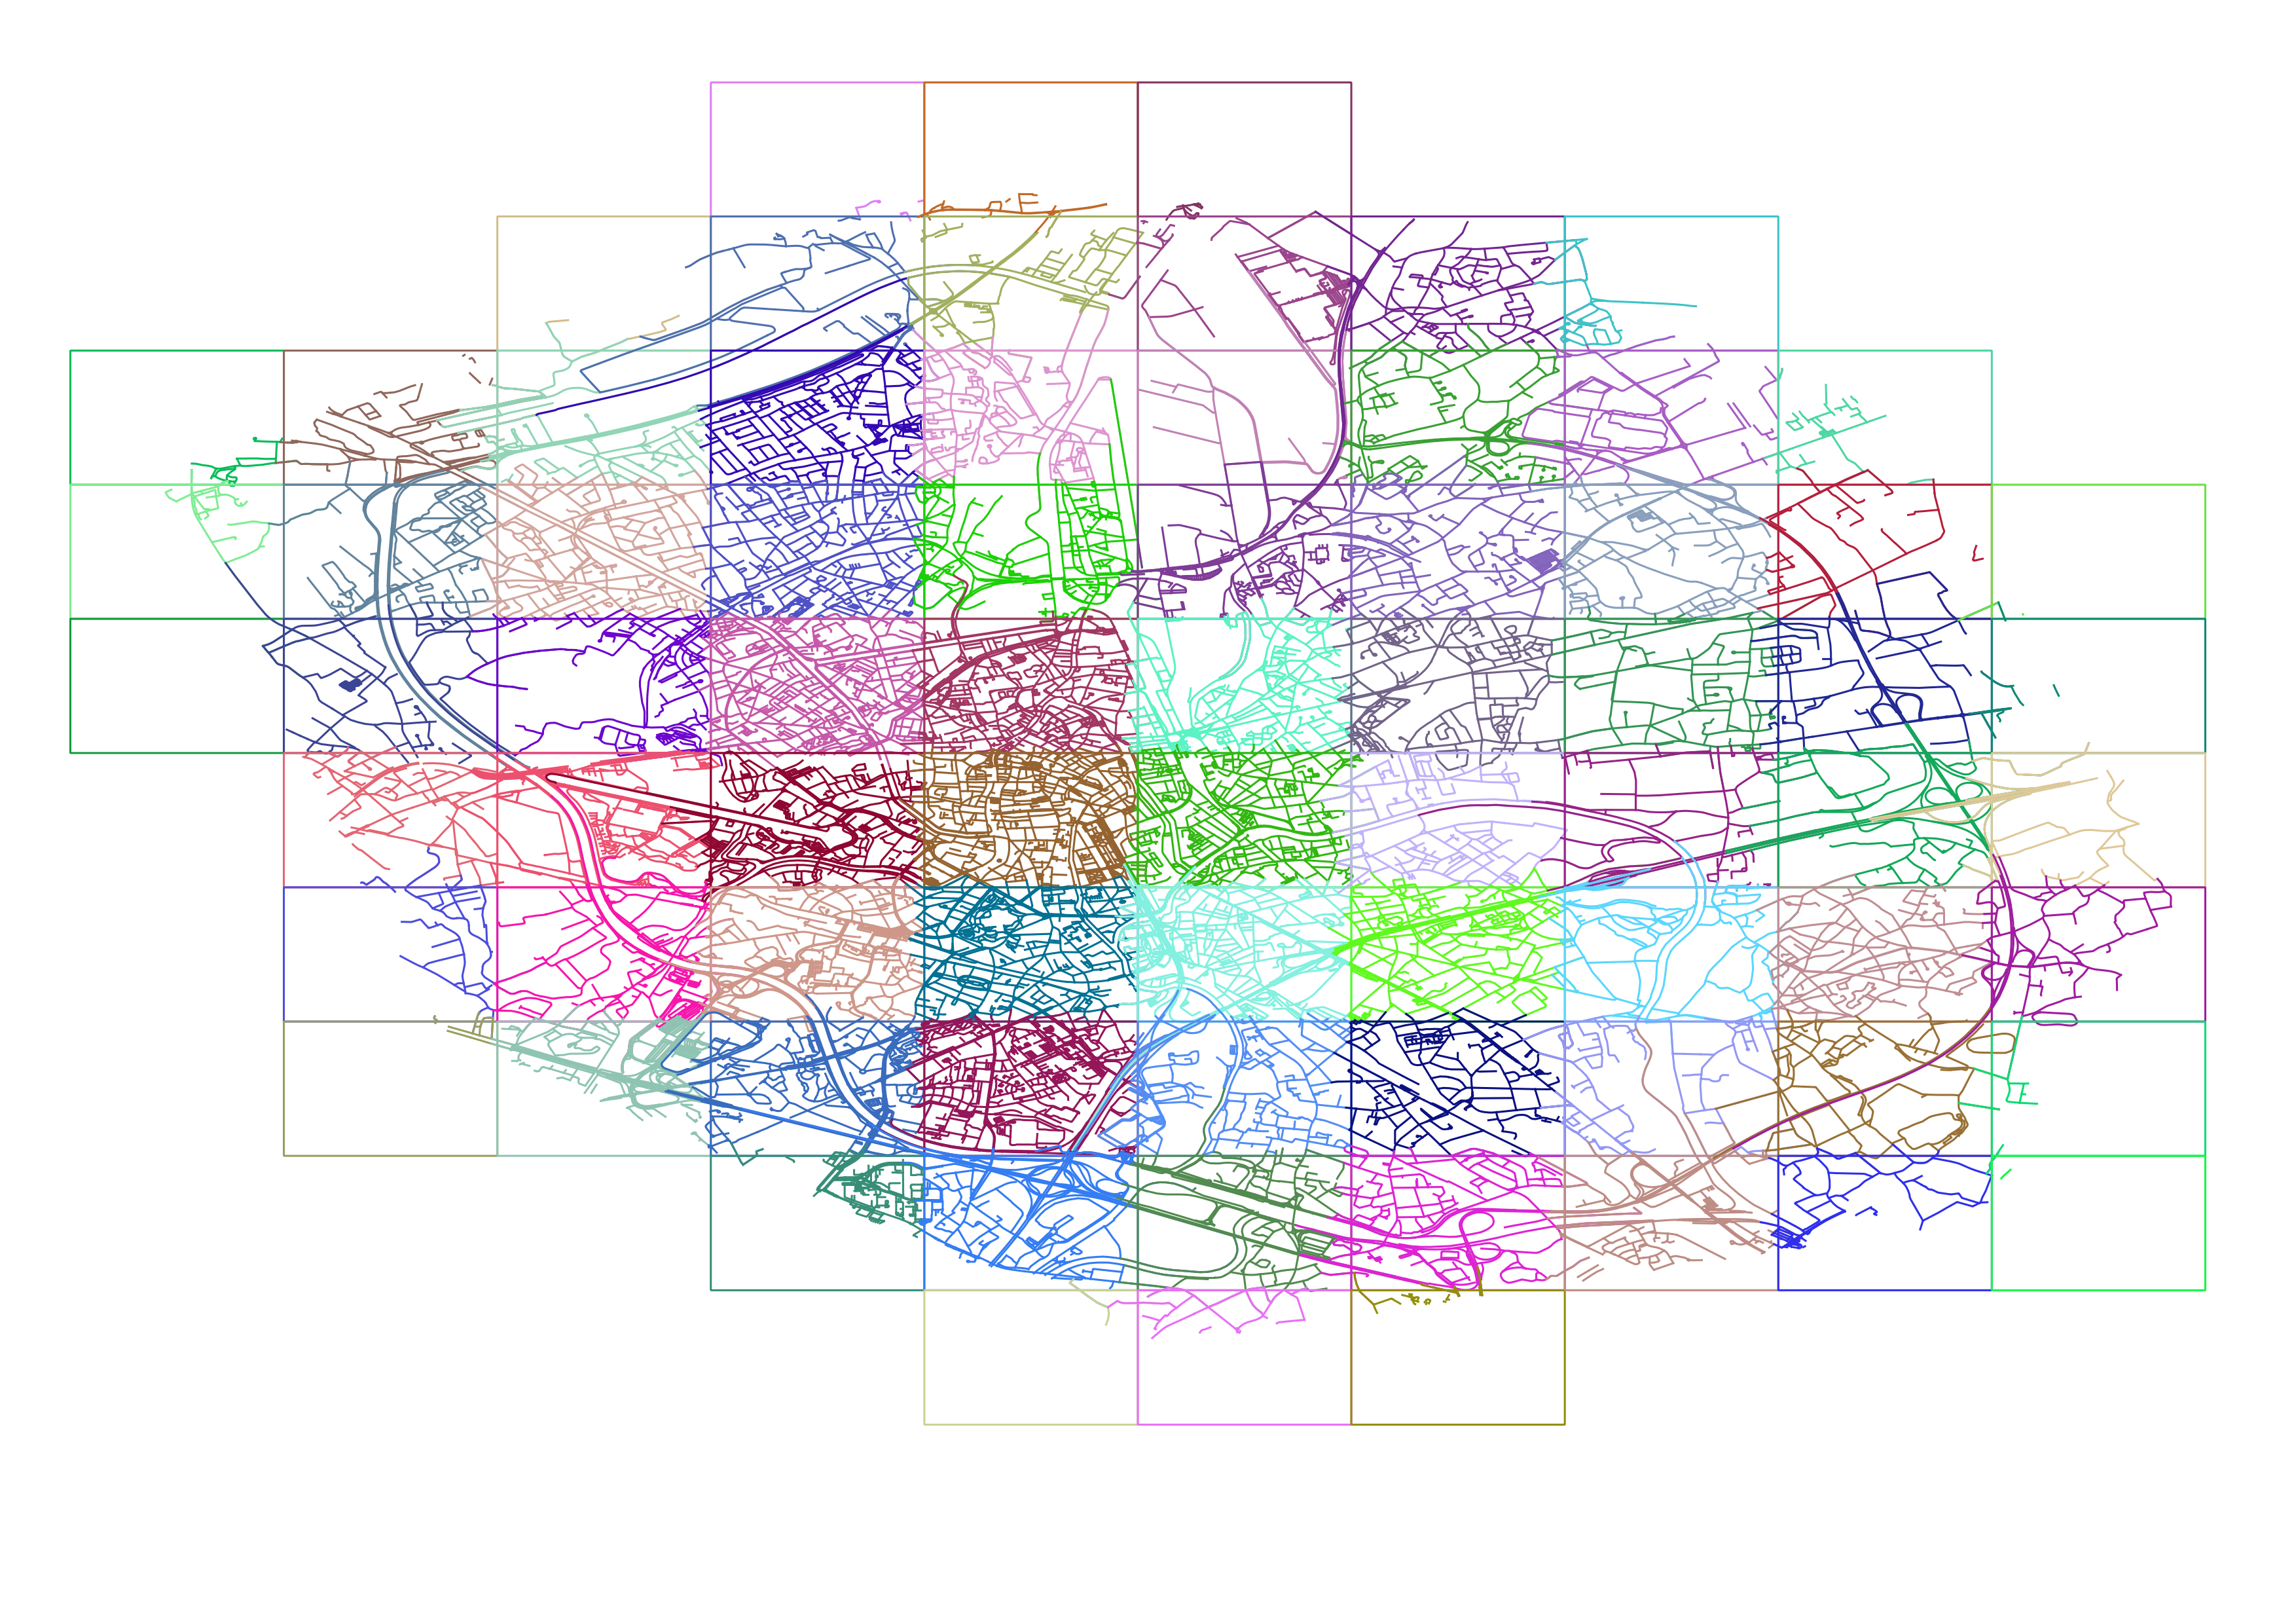
2. Tiling
It is strange that it’s common for an image mapping layer to implement tiles, and that there’s even a standard way to create “Slippy Maps” APIs (these allow you to pan around, while the client downloads the right tiles to fill the screen). Yet, for data, tiling is not that common. In the same way, we propose to tile geospatial information into tiles.
3. Paged collection ordered by Hilbert index
If there is a way to expose that a paged collection is ordered (I proposed this here to the Hydra community), then we could expose a Hilbert index for fragmenting the dataset in chunks of 50kb. The client could then, using binary search, be able to select the right pages it needs to download. While this will probably not beat the tiling approach, the creation of such a Hilbert index and merely ordering the collection in this way might be significantly more easy for a data publisher.
Time series

The tricky part with time series is that they keep increasing. And once you have data with over a year of updates, it becomes ridiculous to suggest to a reuser that they have to download the entire year in order to calculate a simple average. Therefore, we suggest also adding statistical summaries of your data across different fragments of observations. We have started implementing and testing this as part of the Linked Times Series server project.
What else?
I’m intrigued whether the results on cost-effiency and performance are going to be worse, similar or better than the state of the art. Yet, what if we have changing geospatial data that we want to do a full text search query on? The really interesting happens when we combine multiple of these technologies. In order to make sure all our building blocks are reusable, interchangeable and interoperable, we are building a highly module querying engine called Comunica.
Non research goals
I want to create a vivid open-source community with a route planner written in JavaScript
We have a first alpha version of a client-side route planner written in JavaScript, consuming #opentransport #opendata automatically. Now published on @npmjs. Support for @delijn and @NMBS. Pull requests welcome 🚃🚀🤓 https://t.co/eSNqBFRUv5 pic.twitter.com/KsiLjRpFaz
— Pieter Colpaert (@pietercolpaert) 27 december 2018I want to get the Tree Ontology, an approach for geospatial tiles, as well as a more advanced apporach for the Partial Collection View to be adopted in standards.
I want Datex2 as well as Transmodel to be published as a Linked Data vocabulary.
I want the four public transport operators in Belgium to have a Linked Dataset for their service offering.
I want a dataset published of all the roads in the world, that can immediately be used by route planners.
2019 is also the last year of the current Smart Flanders programme. Smart Flanders has probably been the main inspiration for these research questions. The Open Data charter was launched and the first datasets were published compliant to the technical principles. In 2019 I hope to push forward the technical readiness of local governments to implement Linked Open Data.
Want to add your data project to our goals? Our growing team is open to your challenges!